Reach out to service@etr.ai to learn more about the vendor reports and Regression Model or begin your your Free Trial right now
In January ETR collected anticipated 2022 IT budgets from over 1,200 IT decision-makers globally. Since then, however, there have been major macroeconomic events that could impact these original CY22 plans. Now approaching the end of 1Q, ETR is asking its community of end-users for any revisions to their original 2022 IT budgets, and over 900 respondents have already submitted their updated plans via ETR’s April ’22 Technology Spending Intentions Survey.
Polling will continue until 4/8 and ETR will host its Findings Webinar on 4/22. But before we look forward, we want to reflect back on our January 2022 survey with another self-graded ‘Report Card’ for a handful of vendors from ETR’s Viewpoint List (published 1/21/22). These viewpoints were based on original 2022 IT spend data collected from ~1,200 IT End Users between 12/7/21 - 1/10/22.
ETR's January '22 Report Card:
CrowdStrike (Positive Outlook) Grade: A | View JAN22 Report
ETR 2022 Outlook: Enterprise pervasion continues to grow while maintaining minimal churn rates & impressive performance in shared accounts with legacy endpoint detection vendors.
Earnings Recap: CrowdStrike reported F3Q (Oct) revenue to $380.1M (+63.5% y/y vs +69.7% last q) vs cons $363.6M, guided F4Q (Jan) revenue to $406.5M-$412.3M ($409.4M at midpoint, or +54.5% y/y) vs cons $400M, and guided FY22 (Jan 22’) revenue to $1.4271B-$1.4329B ($1.430B at midpoint, or +63.5% y/y) vs cons $1.40B. The revenue beat was driven by subscription revenue ($357M vs cons $339.6M), while professional services revenue slightly missed expectations ($23.0M vs cons $23.9M). The company also reported stronger billings ($480.8M vs cons $468.3M) and deferred revenue ($1.29B vs cons $1.27B).
Our Take: Customer citation growth and positive revenue forecasts made our decision to remain Positive on CrowdStrike an easy one prior to the company’s strong earnings report & guide up which resulted in a +12% stock price reaction.
Datadog (Positive Outlook) Grade: A | View JAN22 Report
ETR 2022 Outlook: Datadog defends its position as a leader among peers with the highest Adoption rate and Net Score among Global 2000 organizations and Pervasion growth only rivaled by Grafana.
Earnings Recap: Datadog reported F4Q (Dec) revenue of $326.2M (+83.8% y/y vs +74.9% last q) vs cons $291.5M, guided F1Q (Mar) revenue to $334M-$339M ($336.5M at midpoint, or +44.1% y/y) vs cons $306.4M, and guided FY22 (Dec 22’) revenue to $1.51B-$1.53B ($1.52B at midpoint, or +47.8% y/y) vs cons $1.40B. The company also reported stronger billings ($411.1M vs cons $339.9M) and deferred revenue ($385.9M vs cons $352.6M).
Our Take: A strong dataset which translated to a great earnings report (revenue beat & guide up) resulting in a +12.3% stock price reaction.
Elastic (Positive Outlook from Neutral) Grade: A- | View JAN22 Report
ETR 2022 Outlook: Strong rebound in InfoSec combined with elevated and stable Analytics data leaves Elastic among the best positioned in the Observability group, warranting a Positive viewpoint on the vendor.
Earnings Recap: Elastic reported F3Q (Jan) revenue of $223.9M (+42.5% y/y vs +42.2% last q) vs cons $209.4M, guided F4Q (Apr) revenue to $230M-$232M ($231M at midpoint, or +30.1% y/y) vs cons $224.1M, and guided FY22 (Apr 22’) revenue to $853M-$855M ($854M at midpoint, or +40.3% y/y) vs cons $833M. The revenue beat was driven by subscription revenue ($209.6M vs cons $197.6M) and professional revenue ($14.3M vs cons $12.5M). The company also reported weaker billings ($233M vs cons $237.5M) and deferred revenue ($395.7M vs cons $418.4M).
Our Take: After stepping down to Neutral in our Oct ’21 survey due to some deceleration, Elastic’s rebound in the Jan ’22 survey led to a strong revenue beat & guide up.
Check Point (Negative Outlook) Grade: A- | View JAN22 Report
ETR 2022 Outlook: No signs of a recovery for Check Point, as its Net Score continues to precipitously decline against a backdrop of low adoptions and increasing churn.
Earnings Recap: Check Point reported F4Q (Dec) Non-GAAP revenue of $599.1M (+6.3% y/y vs +4.9% last q) vs cons $585.8M and guided F1Q (Mar) revenue to $517M-$524M ($520.5M at midpoint, or +4% y/y) vs cons $527.9M.
Our Take: Lowered guidance for F1Q (Mar) did not come as a surprise according to Check Point’s dataset which has seen elevated churn rates for consecutive surveys.
Zscaler (Neutral Outlook from Positive) Grade: B | View JAN22 Report
ETR 2022 Outlook: Despite healthy overall sector positioning and strength within Global 2000 accounts, we’re taking a step down to Neutral on Zscaler due to stagnation in Pervasion levels & increased competitive pressures.
Earnings Recap: Zscaler reported F2Q (Jan) revenue of $255.6M (+62.8% y/y vs +61.7% last q) vs cons $241.1M, guided F3Q (Apr) revenue to $270M-$272M ($271M at midpoint, or +53.6% y/y) vs cons $256.7M, and guided FY22 (Jul 22’) revenue to $1.045B-$1.05B ($1.0475B at midpoint, or +55.6% y/y) vs cons $1.01B. The company also reported stronger billings ($367.7M vs cons $321M) and deferred revenue ($759.9M vs cons $726.2M).
Our Take: Zscaler’s negative stock price reaction from F2Q earnings was largely driven by bottom-line (vs demand); however, softer data & in-line revenue forecasts for F3Q sparked some caution for us in January and led to the step down to a Neutral Outlook. Stay tuned for updated 2022 spending intentions data on Zscaler from the APR22 TSIS.
Coupa (Neutral Outlook) Grade: D | View JAN22 Report
ETR 2022 Outlook: Spending intent on Coupa is strong, especially among F500 organizations, but volatility in recent data sets, along with uncertainty around macroeconomic trends remain concerns
Earnings Recap: Coupa reported F4Q (Jan) revenue of $193.3M (+18.2% y/y vs +39.7% last q) vs cons $186.2M, guided F1Q (Apr) revenue to $189M-$191M ($190M at midpoint, or +13.8% y/y) vs cons $196.1M, and guided FY23 (Jan 23’) revenue to $836M-$840M ($838M at midpoint, or, +15.5% y/y) vs cons $876.4M. The revenue beat was driven by subscription services revenue ($173M vs cons $166.9M) and professional services revenue ($20.3M vs cons $19.1M). The company also reported stronger billings ($318.5M vs cons $291.9M) and deferred revenue ($491.4M vs cons $472M).
Our Take: The Jan ’22 data and our regression model did not anticipate Coupa’s guide down in revenue. This could be a result of lower number of total survey citations (N=65) and/or volatile data since 2H21 that reflects organizational impacts from the global pandemic.
Now that we reviewed a few highlights from our ViewPoint List, let’s turn our grading pencil towards ETR's proprietary Regression Forecast Model from January where ETR backtested our historical data against reported revenue for a number of vendors in our universe in an attempt to predict future revenue for 1-2 quarters out…
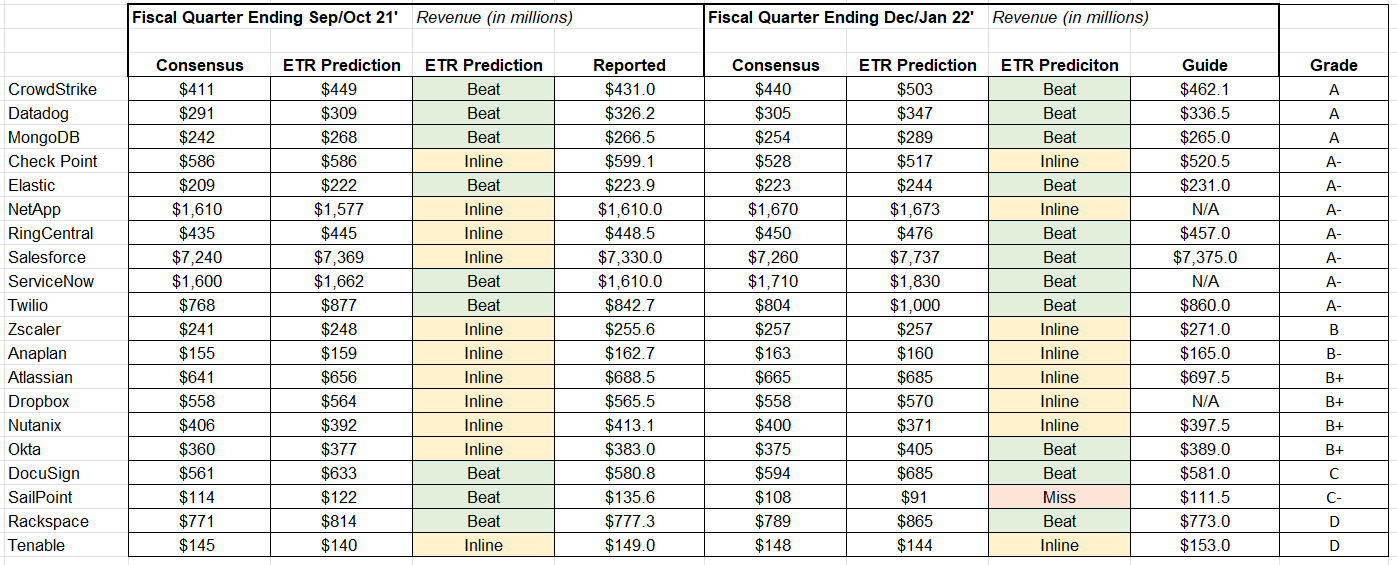
As the chart above depicts, 15 vendor regressions were graded in the A or B category versus only 4 in the C and D categories, supporting the directional accuracy of ETR's proprietary regression forecast models. While only ETR clients can access this information, you can start that client journey by taking the first step...with a Free Trial today.
Enterprise Technology Research (ETR) is a technology market research firm that leverages proprietary data from our targeted IT decision maker (ITDM) community to bring you actionable insights about spending intentions and industry trends. Since 2010, we have worked diligently at achieving one goal: eliminating the need for opinions in enterprise research, which are typically formed from incomplete, biased, and statistically insignificant data. Our community of ITDM’s represents $1+ trillion in annual IT spend and is uniquely positioned to provide best-in-class customer/evaluator perspectives. ETR’s comprehensive proprietary data and insights from this community empower institutional investors, technology companies, and ITDMs to navigate the complex enterprise technology landscape amid an expanding marketplace. Discover what ETR can do for you at www.etr.ai